Note
Go to the end to download the full example code.
Countour plots#
Generating contour plots directly from data.
Support for contour plots directly from a table of precomputed data is relatively limited in pgfplots. [Matplotlib](https://matplotlib.org/) uses contourpy to generate contours out of a matrix of z-values. Using the same underlying engine, pykz can bring this same type of plots directly to pgfplots.
We import the usual libraries.
import numpy as np
import pykz
Let’s generate some data. We do this in exactly the same way as you would using Matplotlib.
x = np.linspace(0, 1, 50)
y = np.linspace(0, 1, 50)


def f(x, y):
    return np.sin(2 * np.pi * x) * np.cos(2 * np.pi * y)


X, Y = np.meshgrid(x, y)
Z = f(X, Y)
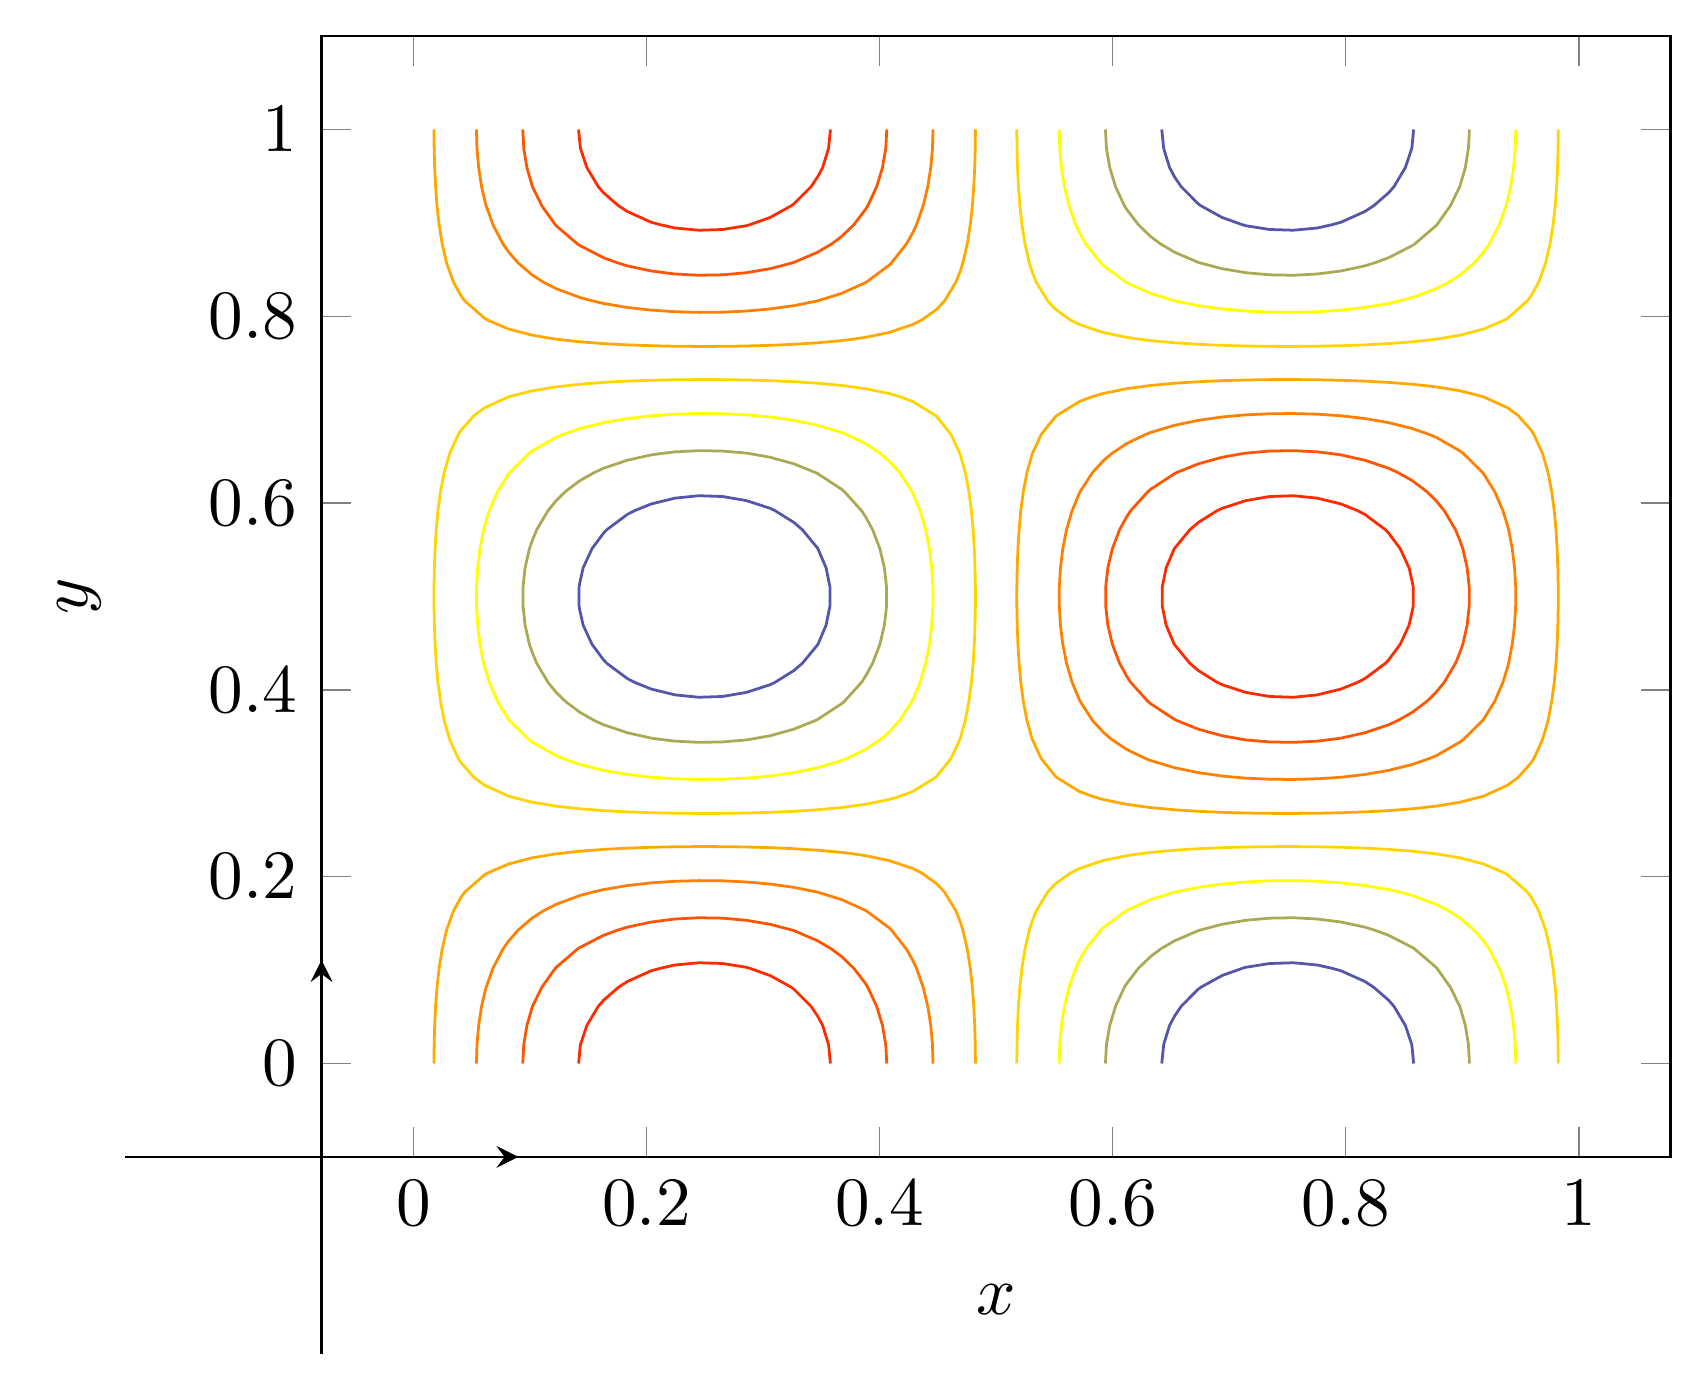
By default, pykz picks the contour levels to draw by dividing the range of z-values into equally spaced bins.
contours = pykz.contour(X, Y, Z)
pykz.xlabel("$x$")
pykz.ylabel("$y$")

# Export your tex code as a standalone file
pykz.save("contour_plot.tex", standalone=True)
# Build the pdf
pykz.io.export_pdf_from_file("contour_plot.tex")
Removing contour_plot.log
Removing contour_plot.aux

PosixPath('contour_plot.pdf')
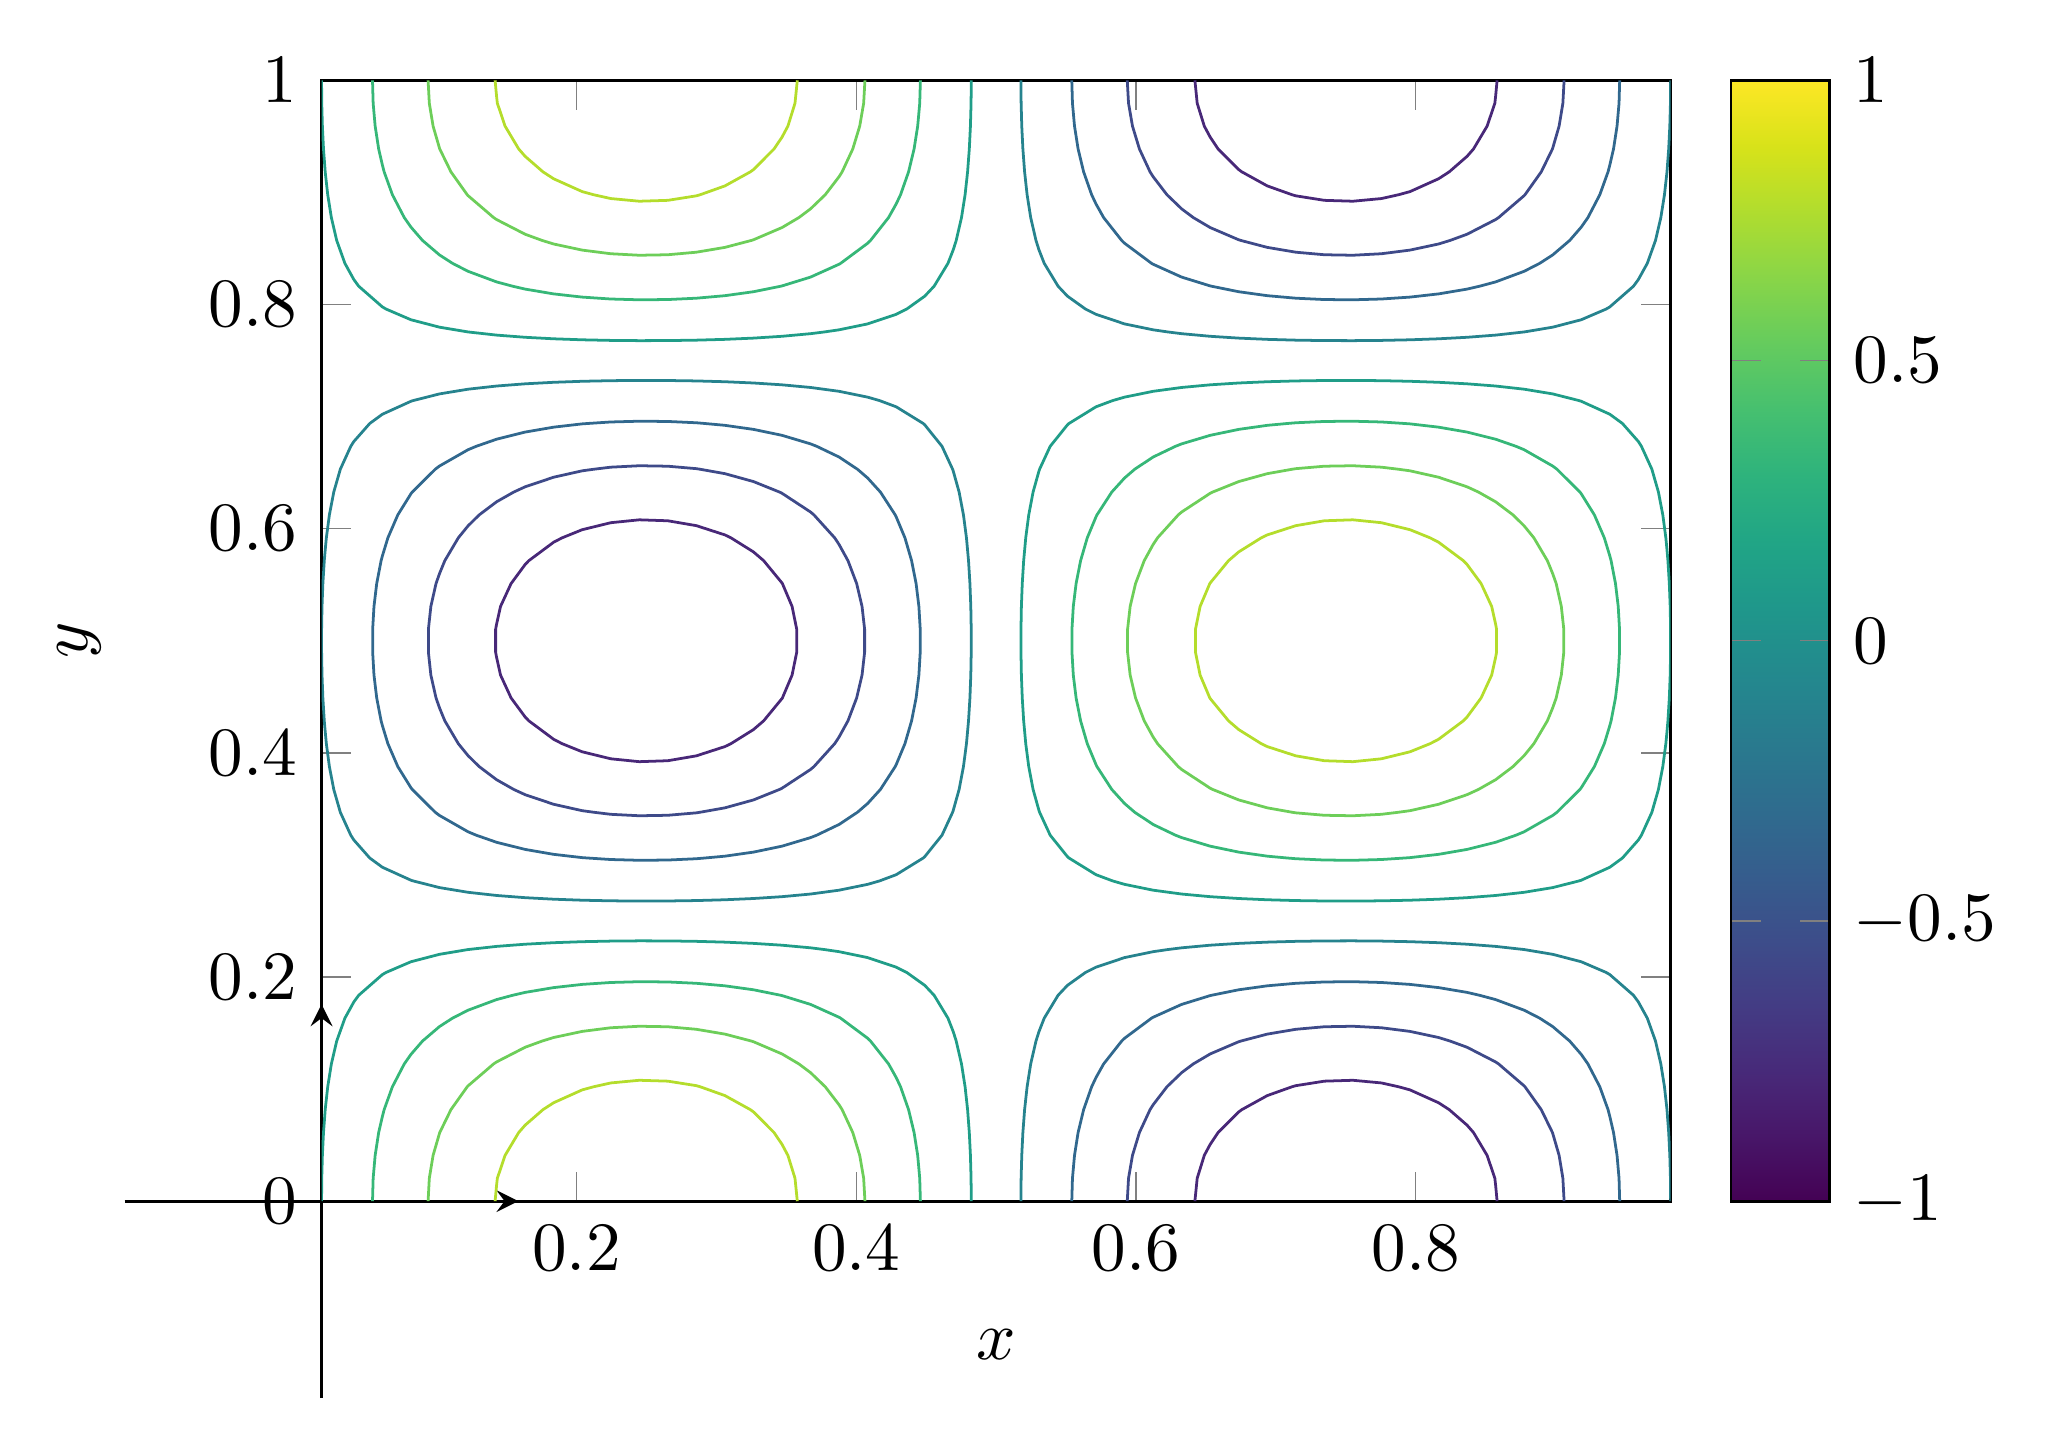
Of course you can also customize the plot in all kinds of ways. For instance, let us change the colormap and visualize the z-values with a colorbar. Also, let us set the x and y limits to be tight.
pykz.colorbar()
pykz.gca().set_option("colormap name", "viridis")
pykz.gca().enlarge_limits(0)

# Export your tex code as a standalone file
pykz.save("contour_plot_fancy.tex", standalone=True)
# Optionally, build the pdf
pykz.io.export_pdf_from_file("contour_plot_fancy.tex")
Removing contour_plot_fancy.log
Removing contour_plot_fancy.aux

PosixPath('contour_plot_fancy.pdf')
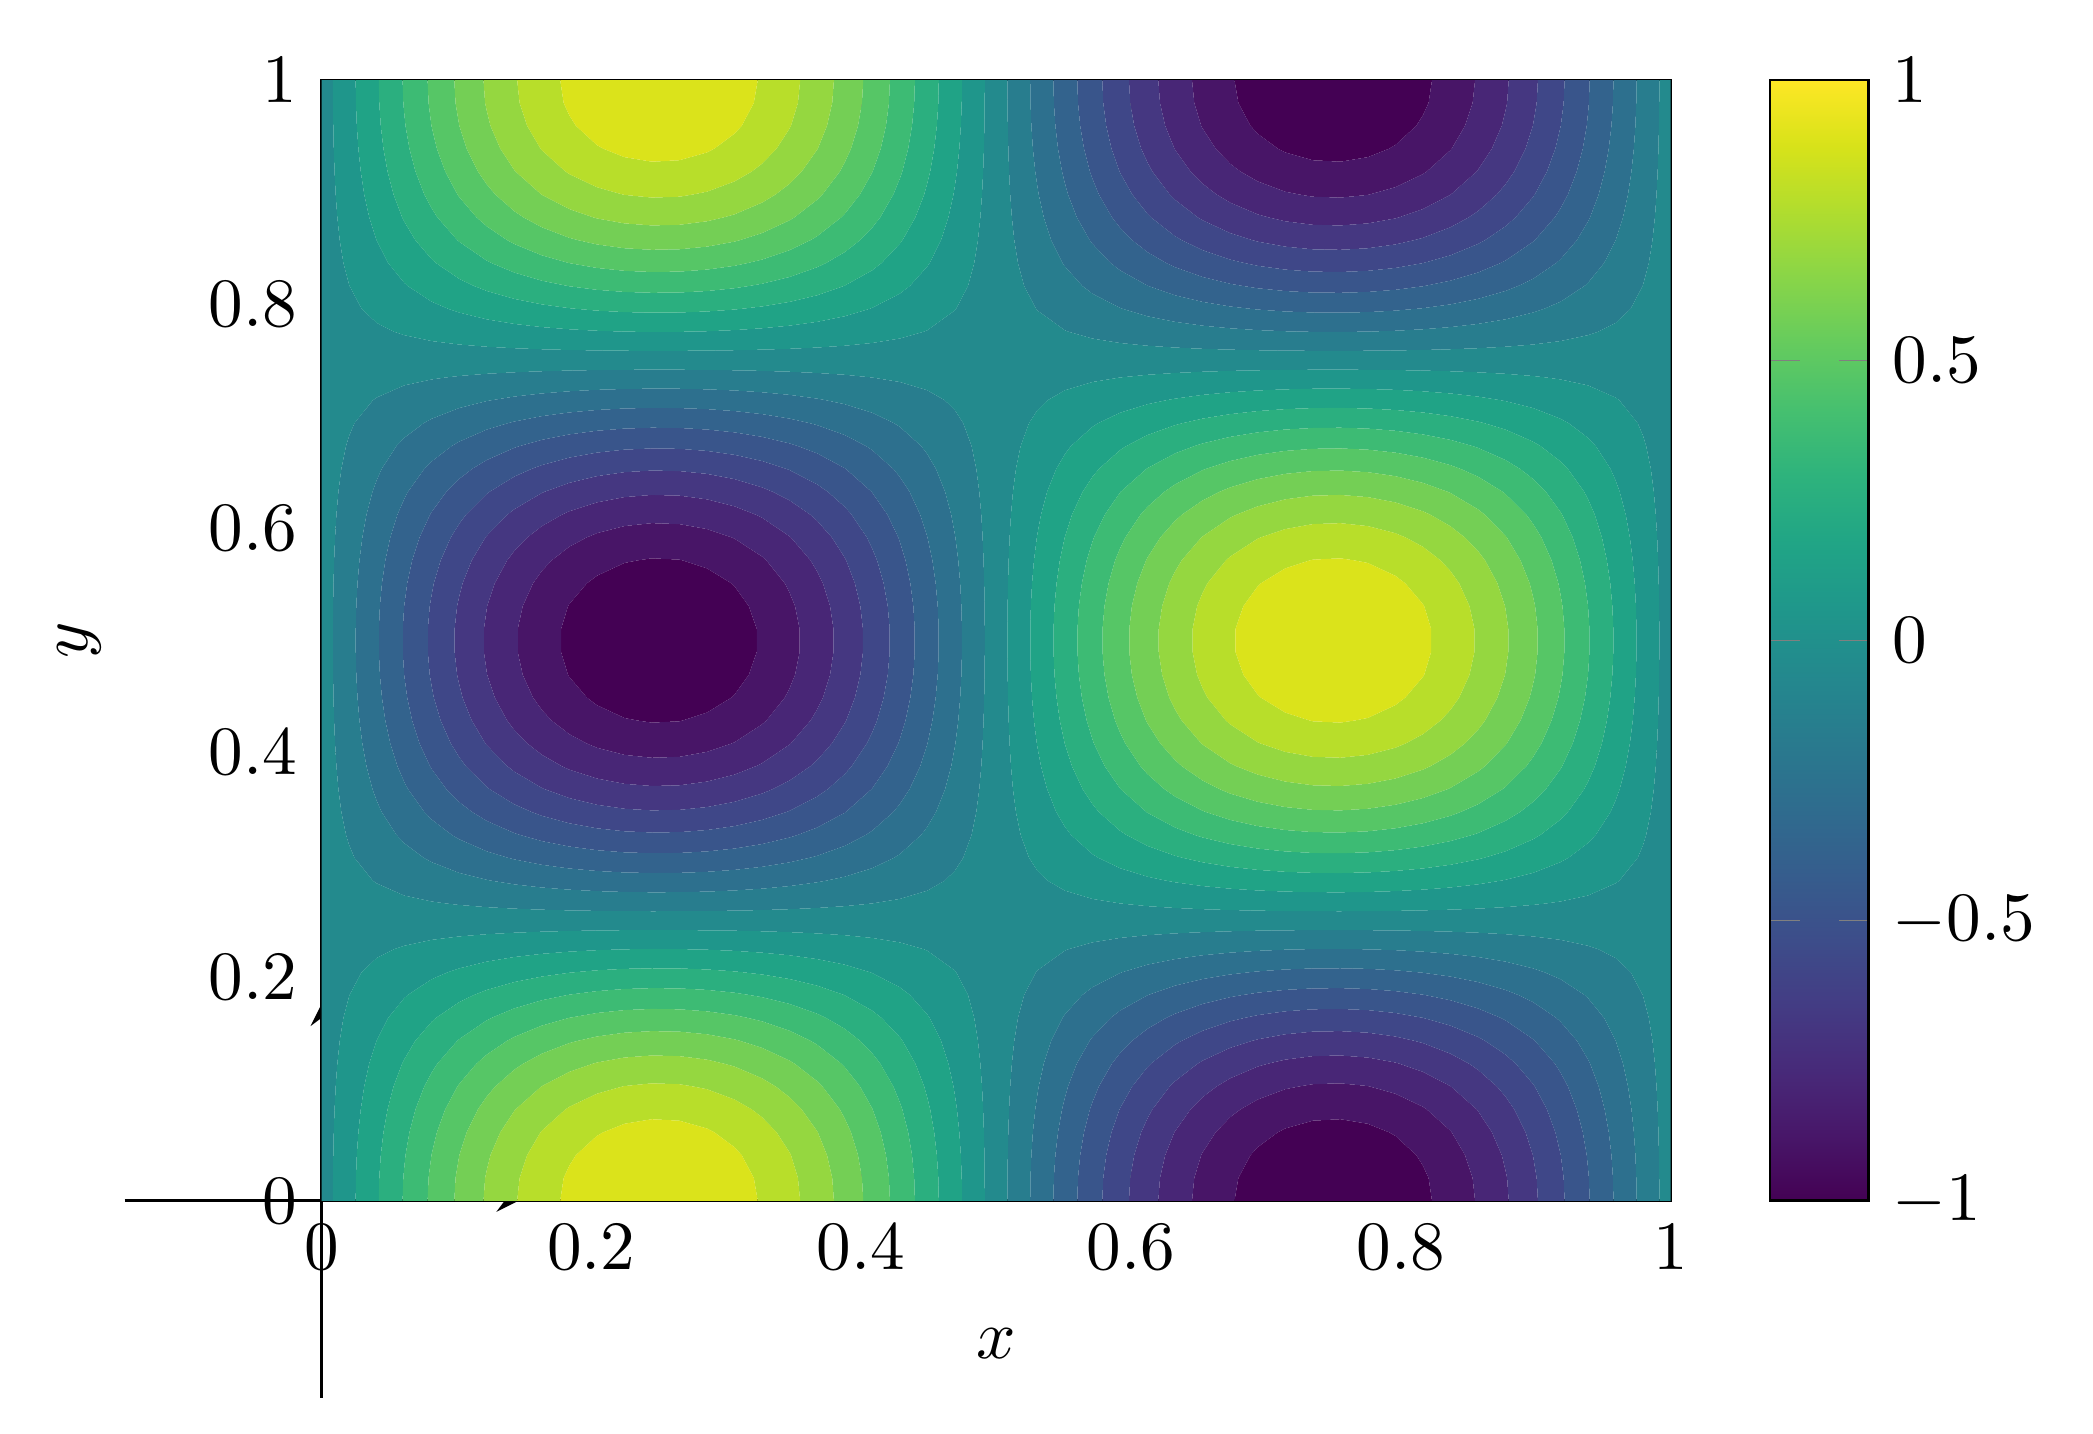
Similarly, we can create filled contours. Let’s get rid of the existing contour, and replace it with a filled contour. Alternatively, we could of course just create a new figure as well. This time, let’s also specify the contour levels we want to show,
for contour in contours:
    pykz.gca().remove(contour)

levels = np.linspace(-1, 1, 20)
contourfs = pykz.contourf(X, Y, Z, levels=levels)

# Export your tex code as a standalone file
pykz.save("contour_plot_filled.tex", standalone=True)
# Optionally, build the pdf
pykz.io.export_pdf_from_file("contour_plot_filled.tex")
Removing contour_plot_filled.log
Removing contour_plot_filled.aux

PosixPath('contour_plot_filled.pdf')
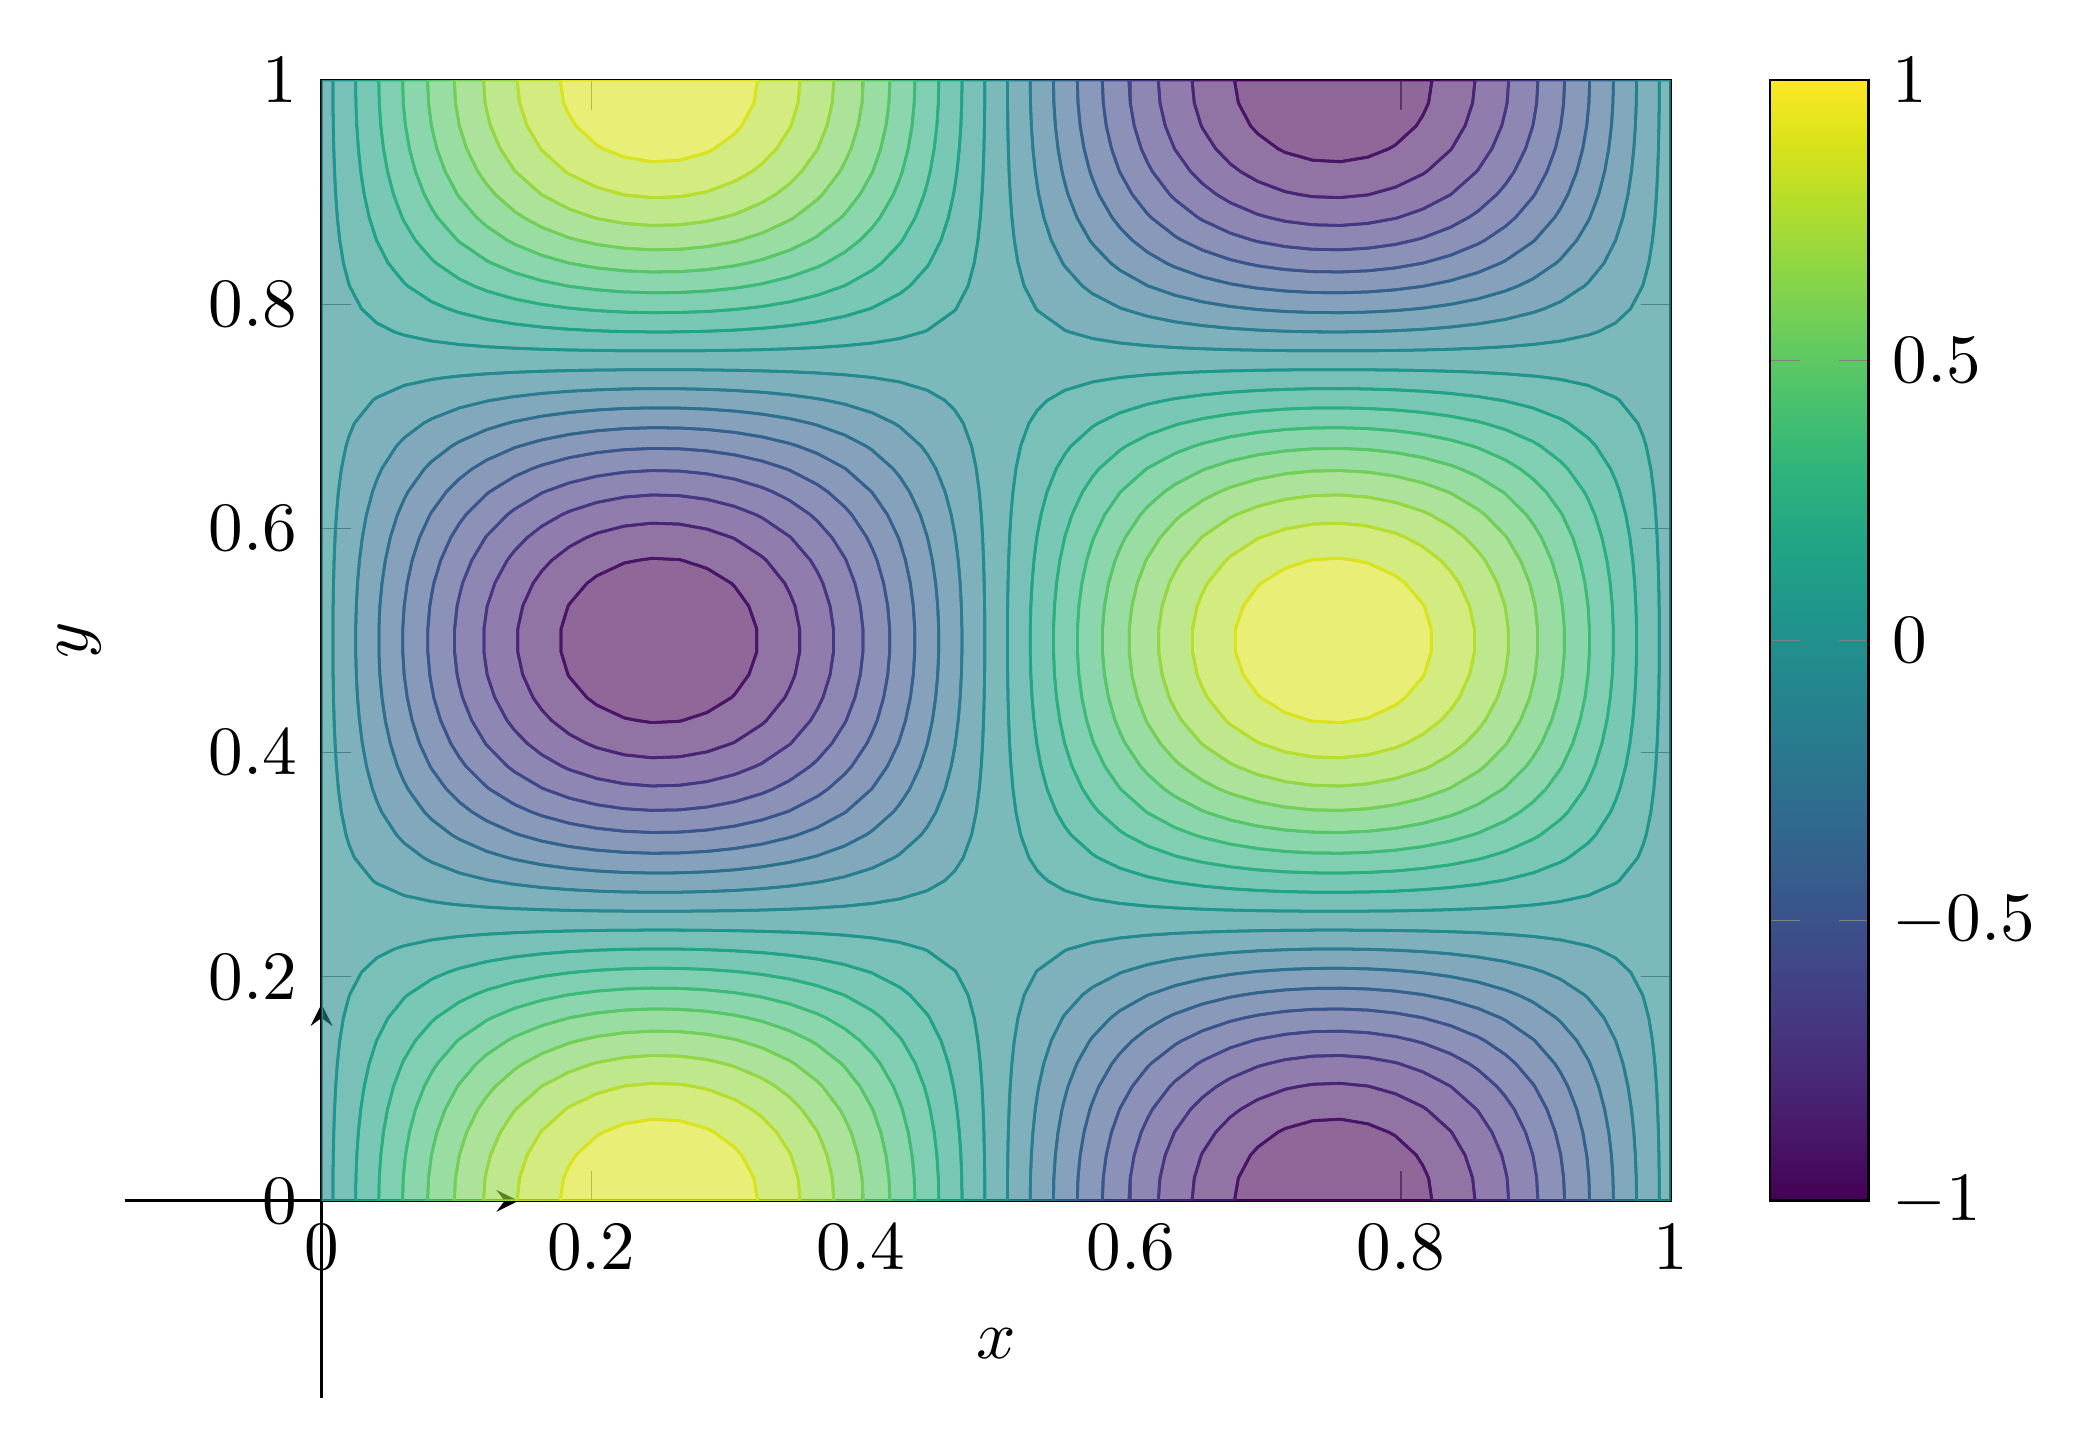
Or, we could go even further in customizing the appearance of the end result, using options that get passed to the generated pgfplots addplot command. Essentially any option that is recognized by pgfplots can be directly added here.
for contour in contourfs:
    pykz.gca().remove(contour)

levels = np.linspace(-1, 1, 20)
contourfs = pykz.contourf(X, Y, Z, levels=levels, draw=True, fill_opacity=0.6)

# Export your tex code as a standalone file
pykz.save("contour_plot_filled_custom.tex", standalone=True)
# Optionally, build the pdf
path_png = pykz.io.export_png_from_file("contour_plot_filled_custom.tex")
print(path_png)
Removing contour_plot_filled_custom.log
Removing contour_plot_filled_custom.aux
contour_plot_filled_custom.png
Total running time of the script: (0 minutes 7.206 seconds)
Related examples